RTSG - State Ownership and the People's Republic
This is a note, this is not my own publication. All rights go to RTSG Media.

https://www.rtsg.media/p/state-ownership-and-the-peoples-republic
It is misconceived by both leftists and rightists that the People’s Republic of China has ceased to plan its economy, and that it had adopted capitalism. Due to reform and opening up. The information that is available on the Western internet on reform and opening up in the PRC is sparse. No evidence on how State-Owned-Enterprises (SOEs) function, nor do they elaborate how proliferated SOEs are.
Formal State Ownership
“State-owned enterprises are an important material and political foundation for Socialism with Chinese Characteristics, and an important pullar and reliance for the party to govern and rejuvenate the country.”
- Xi Jinping, General Secretary of the Communist Party of China
State-owned enterprises are an ever-present fact of the Chinese economy. Such as to that they would not just vanish overnight or erode over time. Since Reform and Opening Up, the quality of SOEs have increased.
The government of the PRc has sought to make the SOEs as efficient and competitive as possible. The top 150 SOEs have become enormously profitable, where the aggregate total of their profits reached $150 Billion in 2007. Most of China’s best-performing companies are found in the state sector, rather than the private sector.
Profit and to make a return on one’s investment is not contradictory to the way state-controlled firms should be run. It would be damaging if the firms were to actively make a loss and waste resources.
Contribution to GDP and Scale of Assets
In 201,, 50% of non-agricultural GDP was generated by SOEs. In regard to economic industries in which SOEs play a dominant or majority role, such as defense, electric power, petroleum and petrochemicals, telecommunications, coal, civil aviation, and shipping; as well as equipment manufacturing, automobiles, information technology, construction, iron and steel, nonferrous metals and chemicals.
In 2018, the number stood at 63.6%, where China;s GDP was RMB ¥82 Trillion, of which non-financial SOEs count for RMB ¥52.2 Trillion. In 2021, SOEs accounted for around 66% of China’s GDP. In terms of overall contribution to GDPm SOEs have played a significant amount, rising over the past 10 years from 50% to 66%, rising approximately 1.6% to their contribution to GDP per year. In 2023, that number climbed to 68% of China’s GDP. China’s GDP was RMB ¥126 Trillion, of which non-financial SOEs accounted for RMB ¥85.7 Trillion.

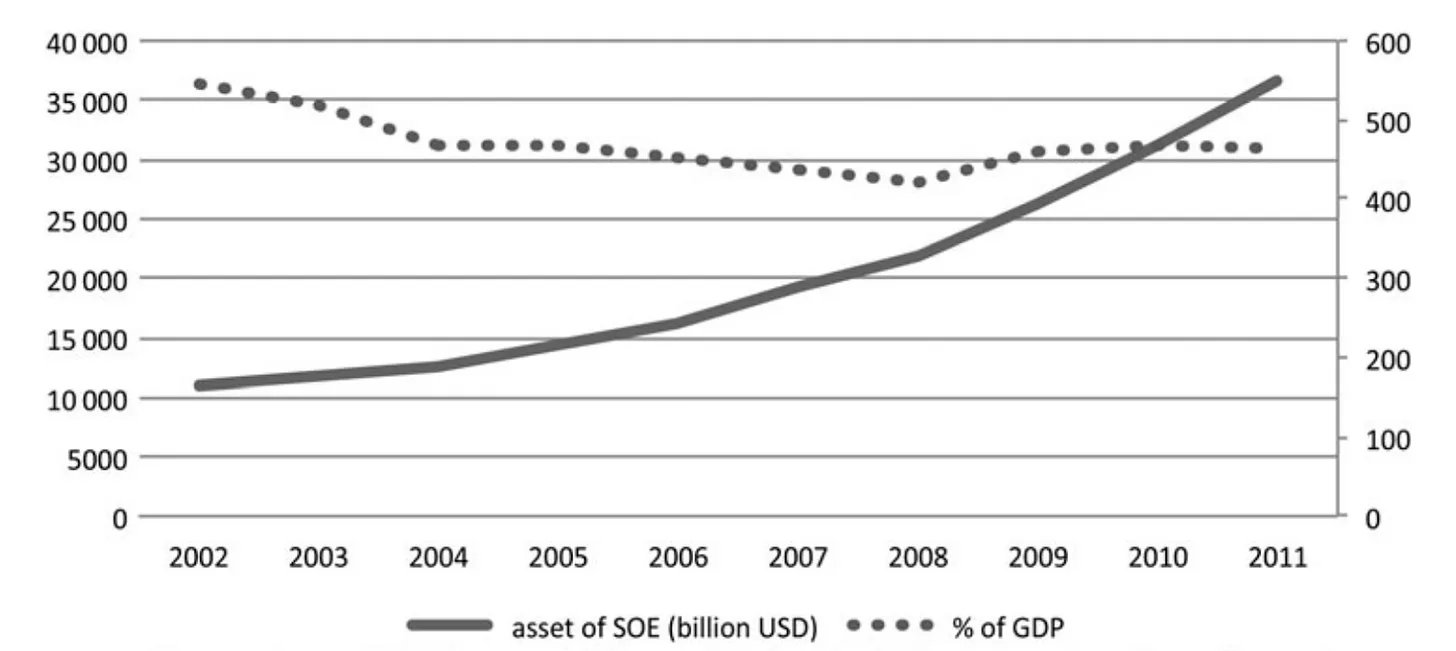
From 2002-2011, the value of SOE assets as a percentage of GDP started at roughly 550% before declining to a rate of roughly 430% by 2008, its lowest point, before reaching a plateau of around 450% since 2009.
There are two formal SOE categories. These are; Financial SOEs (国有金融/中央金融企业), and Administrative SOE assets (行政事业性国有资产). This is why estimations for SOE value may be lost in translations and only partially accurate results can be extrapolated.
In 2018, a study from the IMF found that Non-financial SOEs assets for China as a percentage of GDP amounted to 180% of GDP. While in 2015, Italy, India, Republic of Korea, Saudi Arabia, and Norway’s SOEs did not rise above 50%. According to WSJ, the value of French SOE assets in 2008 as a percentage of GDP amounted to 686 billion USD, which is 28% of GDP. In the same year, Chinese Non-financial SOEs were 6 trillion USD, or 133% of GDP.
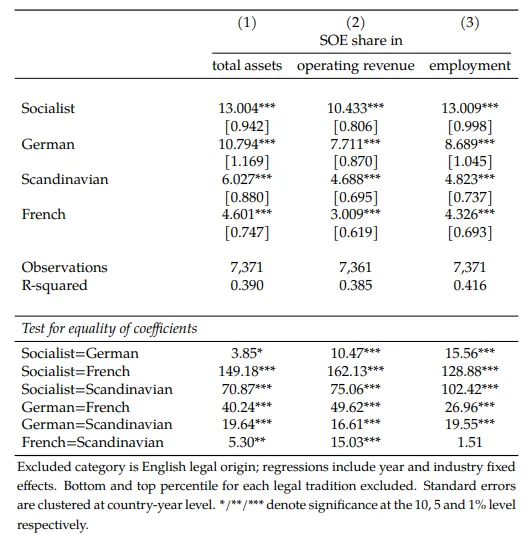
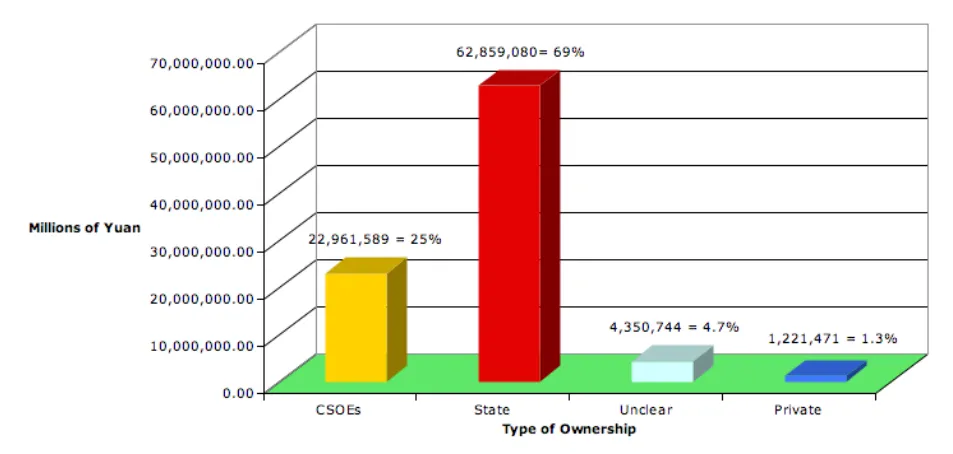
In 2010, 94% of all assets held by the top 150 companies were controlled by the state, which represented 41.2% of all corporate assets in China, out of the total of roughly 5 million registered companies. In 2012, total assets held by the State sector in China amounted to 55.78%. In comparison to European nations during the same year, the total assets of Eastern European nations (former Eastern Bloc) held by the state sector were around 13%. For the Netherlands, Italy, Spain, France, Belgium, and Portugal, it was around 4.60% For Ireland and the UK, even less than that number. For Austria and Germany, around 10.79%. For Scandinavia, it was 6.02%.


Examples of Dominant SOEs
The power-generating industry in China is dominated by five SOE power-generating company groups: China Huaneng Power Group, China Datang Corporation, China Huadian Corporation, China Guodian Corporation, and China Power Investment Corporation. And the public utilities sector is dominated by the State Grid Corporation of China (SGCC) and China Southern Power Grid Corporation. The telecommunications industry in China is dominated by three SOE telecommunications carriers: China Telecom, China Unicom, and China Mobile.